Web Performance Recipes
Web Performance Recipes is a collection of practical guides to making websites faster. Each recipe explains a common performance issue or pattern, shows how to measure it, and walks through the steps to fix it.
Web performance is not a technical-only topic. Speed affects user experience, conversions and search visibility, so the recipes are written for anyone who works on web projects — developers, designers, content editors and marketers alike.
Simple explanations (but also advanced) of common web performance issues and patterns. Easy to use speed tools but also advanced ones.
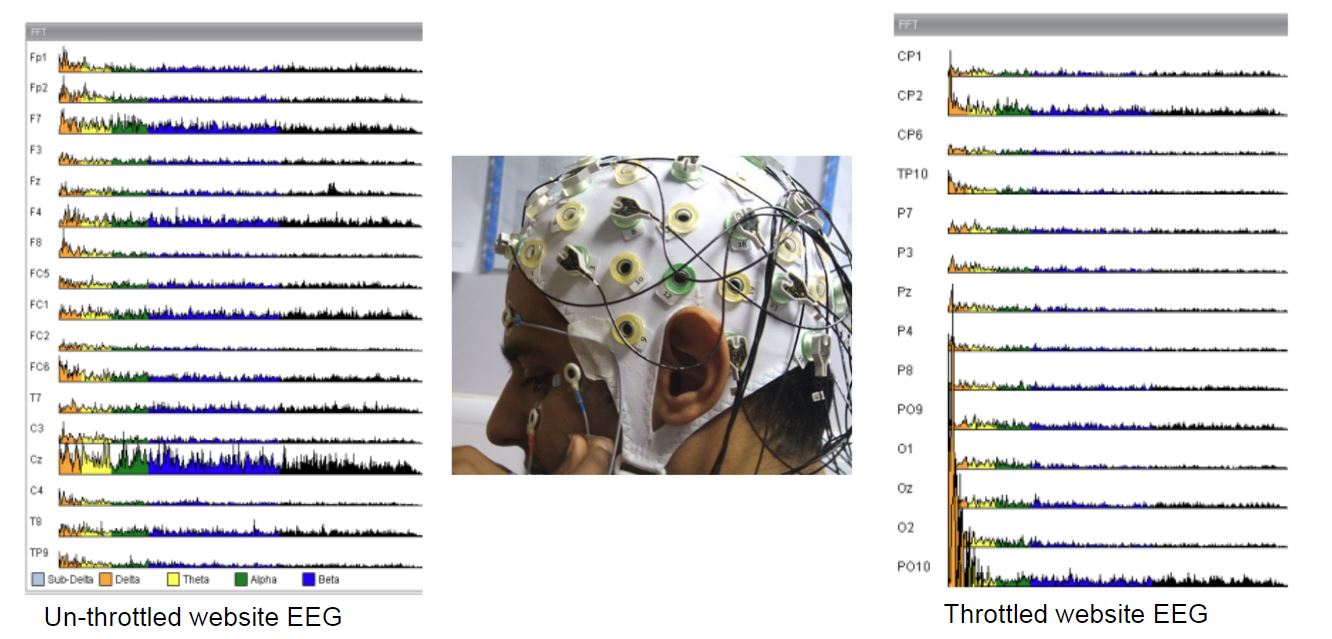
Why Web Performance Matters Beyond Technical Metrics
Web performance is often framed as a purely technical discipline—something for developers to worry about while marketers, designers, and content creators focus on their own domains. But the reality is that speed touches every aspect of a website's success. A slow-loading page doesn't just frustrate users; it erodes trust, reduces conversions, and can even hurt your search rankings. When we talk about performance, we're talking about the user's experience, the business's bottom line, and the brand's reputation all at once.
Consider the last time you clicked a link and waited more than a few seconds for the page to appear. Did you stay? Most people don't. Studies consistently show that bounce rates increase dramatically as load times grow. This isn't just about impatience—it's about perceived reliability. A fast site feels professional and trustworthy, while a slow one can make even the most polished design seem broken. That's why performance should be a shared responsibility across the entire team, not just a checklist item for engineers.
At the heart of this philosophy is the idea that performance is a recipe, not a mystery. Each ingredient—images, scripts, styles, server response—can be measured, adjusted, and combined in different ways to achieve the desired result. The recipes on this site are designed to demystify that process, offering clear, actionable steps that anyone can follow, regardless of their technical background.
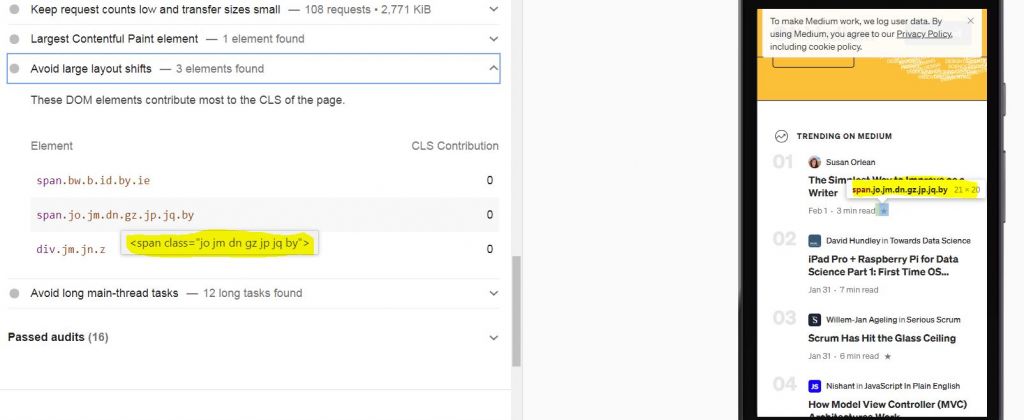
The Anatomy of a Slow Page
Before you can fix a problem, you need to understand where it comes from. Most slow pages share a common set of culprits, and identifying them is the first step toward improvement. Here are the usual suspects:
- Unoptimized images—Large, uncompressed images are the single biggest contributor to page weight. A single high-resolution photo can easily exceed 5 MB, which is more than an entire page should weigh.
- Too many requests—Every CSS file, JavaScript library, font, and icon adds a separate HTTP request. Even if each one is small, the overhead of dozens of round trips can add seconds to load time.
- Render-blocking resources—Scripts and stylesheets that load in the can prevent the browser from rendering content until they're fully downloaded and parsed.
- Poor server response time—If your server takes 500 ms just to start sending the HTML, no amount of front-end optimization will make the page feel fast.
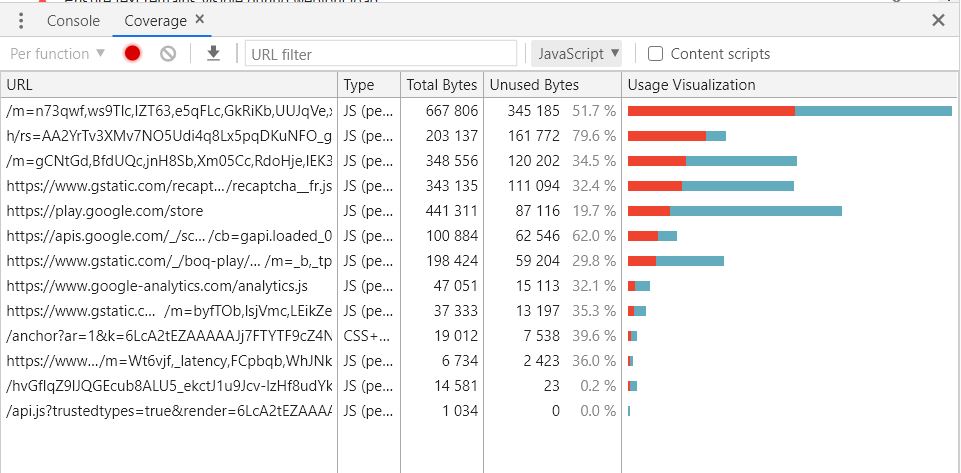
- Third-party scripts—Analytics, ads, social widgets, and chat tools all add weight and complexity, often with unpredictable performance impacts.
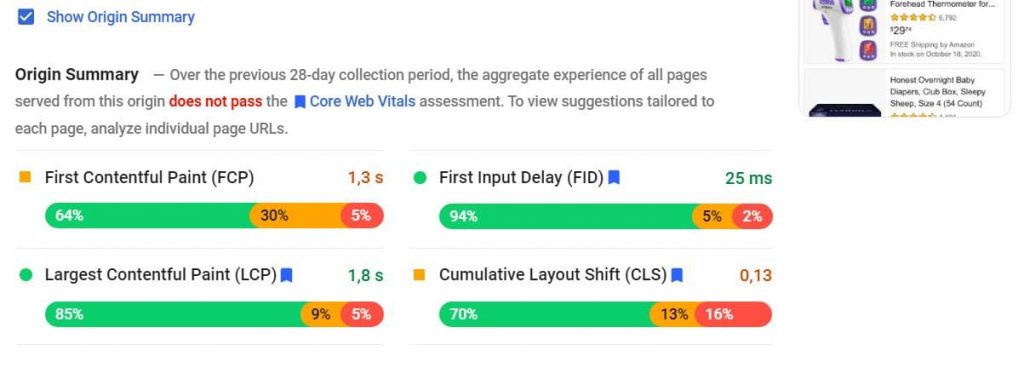
Each of these factors can be addressed with specific techniques, and the recipes in this collection walk through them one by one. The key is to measure first, then optimize the biggest offenders. Tools like Core Web Vitals Guide can help you pinpoint exactly where the bottlenecks are.
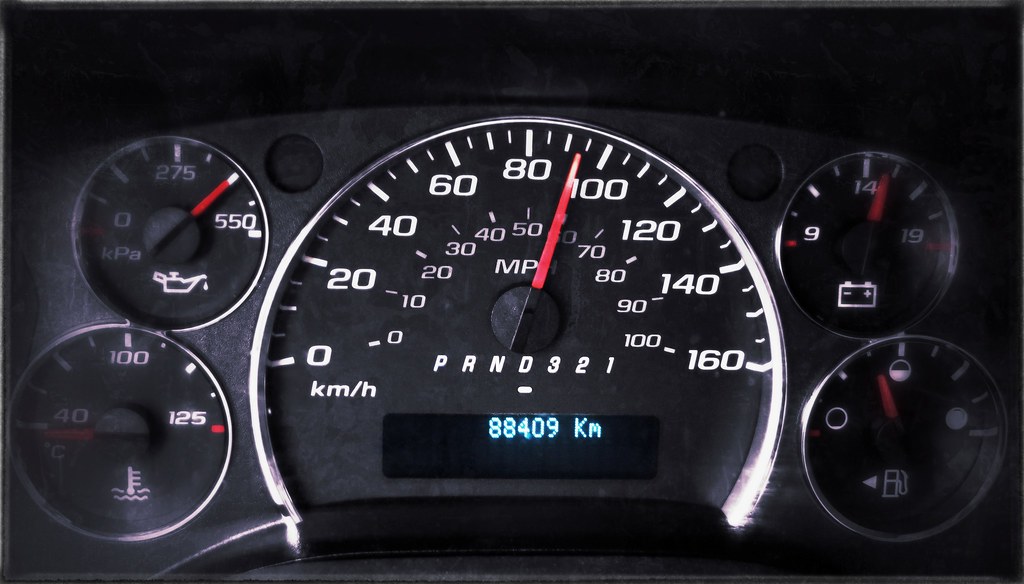
From Measurement to Action: A Practical Workflow
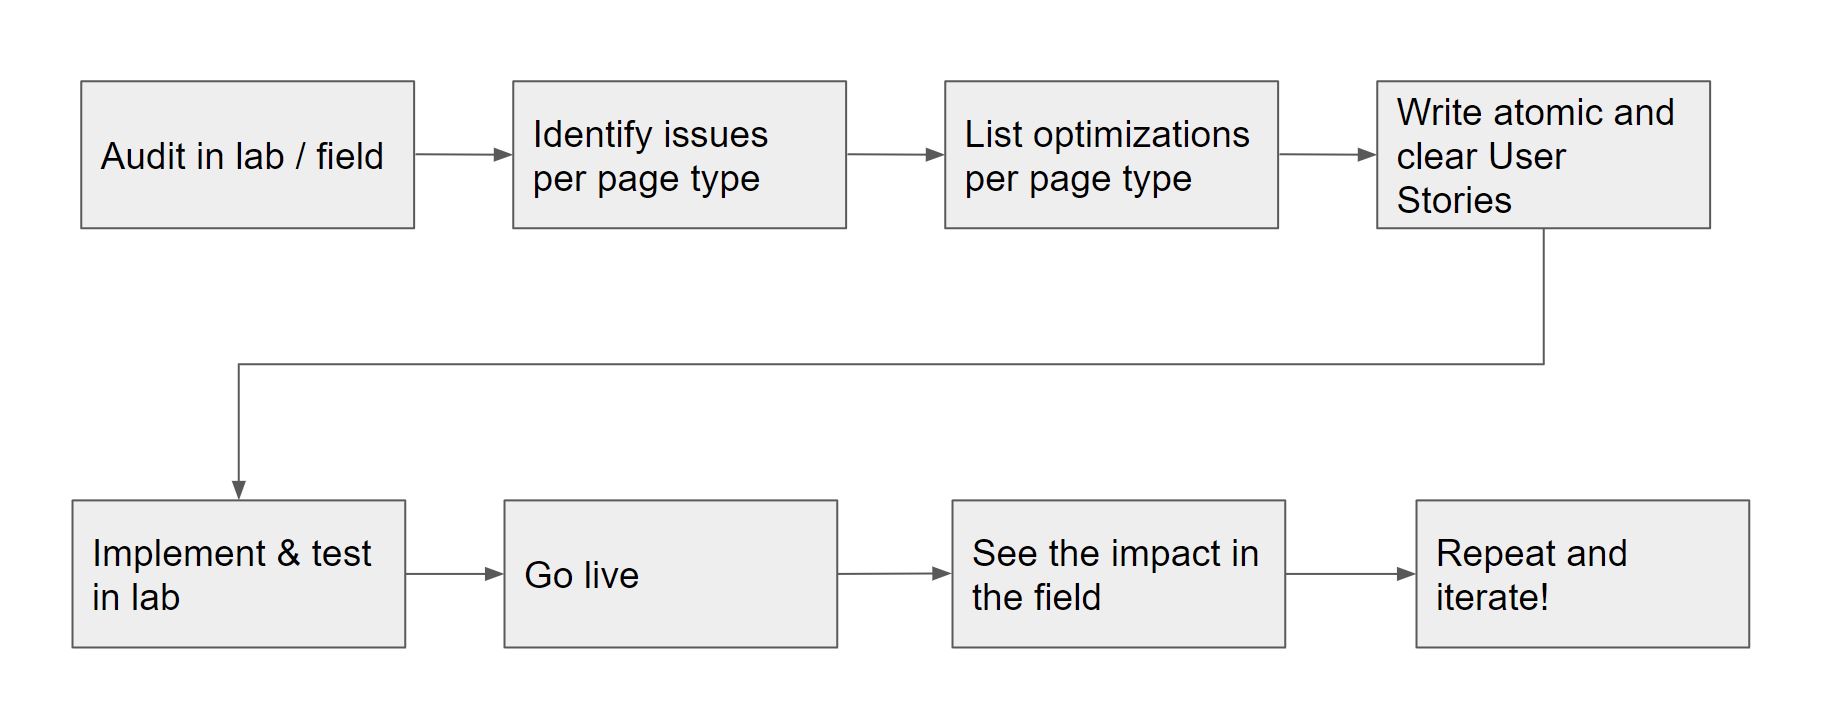
One of the most common mistakes in performance work is jumping straight to optimization without a clear baseline. You might spend hours compressing images only to find that your server response time was the real problem all along. That's why a structured approach is essential.
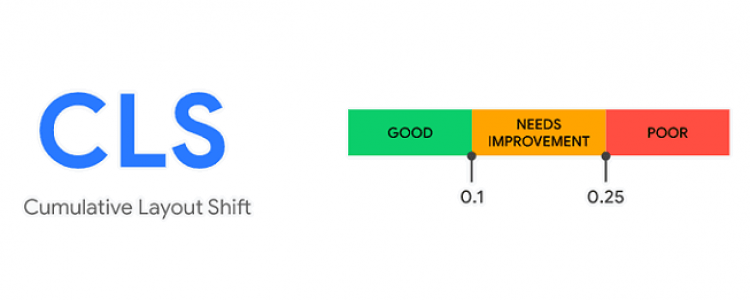
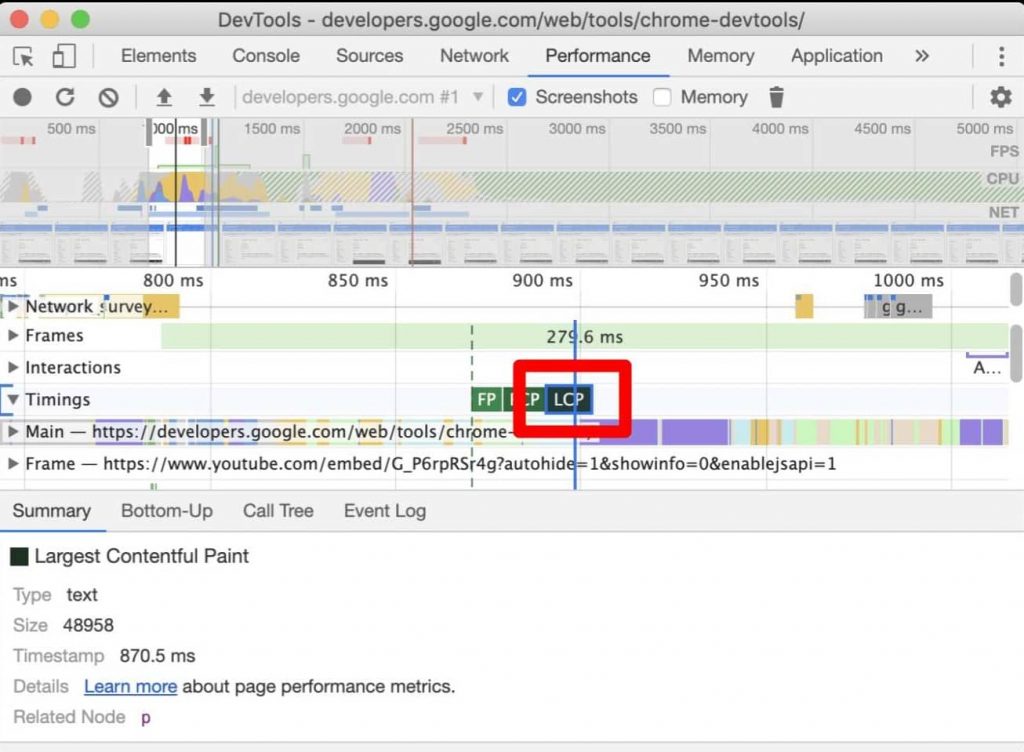
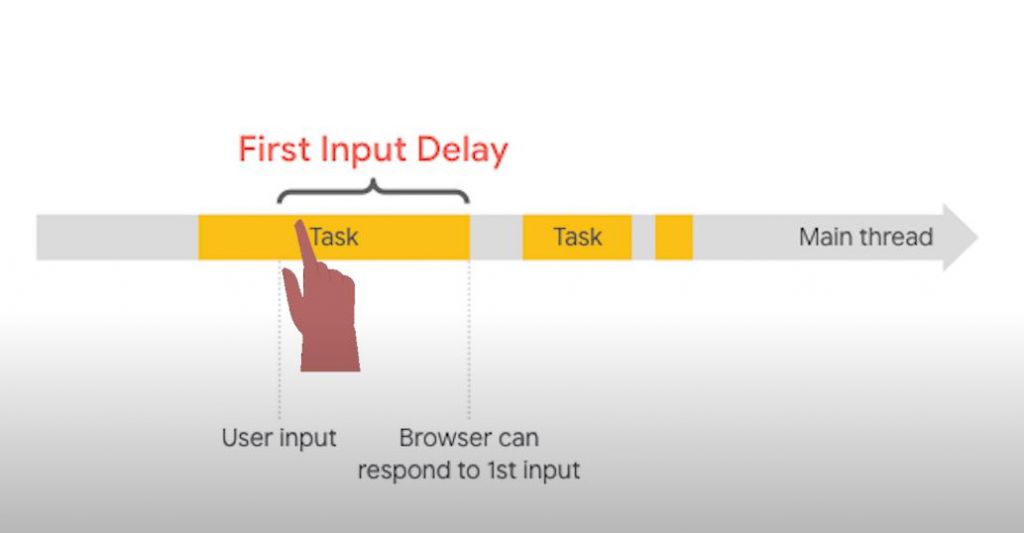
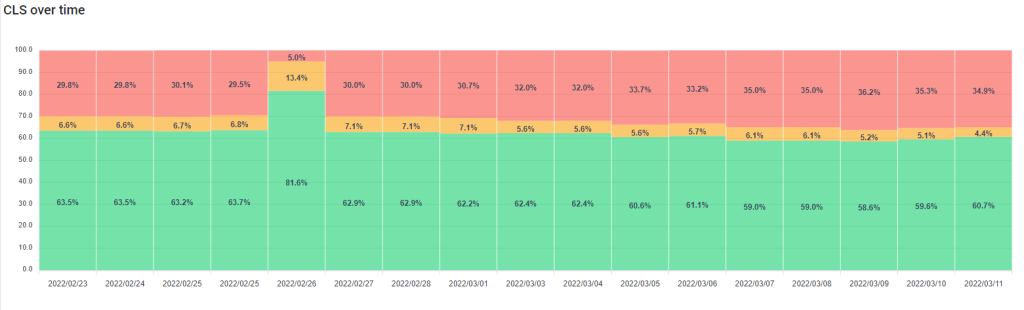
Start by running a few key tests to understand your current state. Look at metrics like Largest Contentful Paint (LCP), Cumulative Layout Shift (CLS), and First Input Delay (FID) or Total Blocking Time (TBT). These are the foundation of Google's Core Web Vitals, and they give you a balanced view of loading speed, visual stability, and interactivity. For detailed guidance, check out Measure and Optimize LCP, Measure and Optimize CLS, and Optimize FID and TBT.
Once you have your baseline, set realistic goals. You don't need to achieve perfect scores on every metric—just aim for improvements that make a tangible difference for users. Then, tackle the changes one at a time, re-measuring after each step to see the impact. This iterative process not only builds momentum but also helps you learn which optimizations matter most for your specific site.
Common Recipes for Immediate Wins
While every website is unique, certain optimizations tend to deliver quick results across the board. Here are a few recipes that often provide the biggest bang for your buck:
- Compress and resize images—Use modern formats like WebP or AVIF, and serve images at the exact dimensions they'll be displayed. Image CDNs and build-time optimizers can automate this process.
- Minify CSS and JavaScript—Remove unnecessary whitespace, comments, and code. This reduces file size without changing functionality.
- Enable browser caching—Set appropriate cache headers so returning visitors don't have to re-download unchanged resources.
- Defer non-critical scripts—Move JavaScript to the end of the body or use the defer attribute to prevent it from blocking rendering.
- Use a content delivery network (CDN)—Serve static assets from servers closer to your users to reduce latency.
These recipes are explained in detail throughout the site, with step-by-step instructions and explanations of why they work. For a broader overview of available resources, visit Web Performance Resources.
Performance as a Continuous Practice
Web performance is not a one-time project; it's an ongoing commitment. As your site evolves—new features, new content, new third-party integrations—performance can regress if you're not vigilant. That's why it's important to integrate performance checks into your regular workflow.
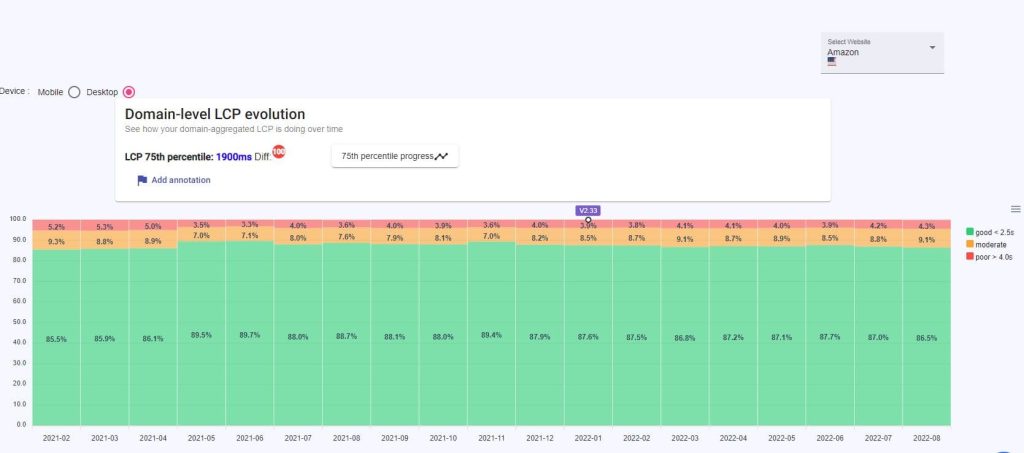
Set up automated monitoring to alert you when key metrics cross a threshold. Run performance budgets to keep page weight and request counts in check. And make performance part of your definition of "done" for any new feature or update. When everyone on the team understands the impact of their choices, the site stays fast by default.
Remember, the goal isn't perfection—it's continuous improvement. Even small gains can add up to a significantly better user experience over time. The recipes here are meant to be revisited, adapted, and combined as your needs change. With the right approach, you can build a site that not only loads quickly but also feels effortless to use.
Bringing It All Together
Ultimately, web performance is about respect for your users' time and attention. Every millisecond you save is a gift to the person on the other side of the screen. By applying the recipes in this collection, you're not just optimizing a website—you're crafting a faster, smoother, more enjoyable experience for everyone who visits.
Whether you're a developer looking for advanced techniques or a marketer wanting to understand why speed matters, there's something here for you. Start with the basics, measure your progress, and keep experimenting. The web is always evolving, and so should your approach to performance.
Web Performance Recipes
- Core Web Vitals GuideWhat are Core Web Vitals? Are they important? How to measure them and how to optimize them? We are going to answer all of these questions in this guide.
- Web Performance ResourcesWhat are Core Web Vitals? Are they important? How to measure them and how to optimize them?
- Measure and Optimize LCPLargest Contentful Paint (LCP) is one of the most important user experience and web performance metrics. LCP is part of Web Vitals, essential metrics for a healthy website defined by Google.
- Measure and Optimize CLSCumulative Layout Shift (CLS) is one of the most important user experience and web performance metrics.
- Optimize FID and TBTWhen Largest Contentful Paint is for loading performance, Cumulative Layout Shifts for visual stability, the pair “Total Blocking Time/First Input Delay” is for page interactivity and responsiveness.