
Core Web Vitals are vitals
What are Core Web Vitals? Are they important? How to measure them and how to optimize them? We are going to answer all of these questions in this guide The Web is suffering: Let’s make a statement to begin. We are sending more and more kilobytes to users. According to ..Continue Reading
Achieve interactivity with good TBT and FID
When Largest Contentful Paint is for loading performance, Cumulative Layout Shifts for visual stability, the pair “Total Blocking Time/First Input Delay” is for page interactivity and responsiveness. All of these metrics are part of Web Vitals, an initiative by Google to provide shared quality signals to evaluate the user experience ..Continue Reading
Cumulative Layout Shift: measure and optimize it
Cumulative Layout Shift (CLS) is one of the most important user experience and web performance metrics. CLS is part of Web Vitals (LCP, FID, and CLS), essential metrics for a healthy website defined by Google. It measures the layout stability of a web page. In this guide, you will understand what ..Continue Reading
Largest Contentful Paint: measure and optimize it
Largest Contentful Paint (LCP) is one of the most important user experience and web performance metrics. LCP is part of Web Vitals, essential metrics for a healthy website defined by Google. It measures the loading performance. In this guide, you will understand what LCP is, how to measure it, and, ..Continue Reading

Why Web Performance Matters for Your Business
Web performance is not just a technical concern—it directly impacts user satisfaction, conversion rates, and search engine rankings. Studies show that even a one-second delay in page load can reduce conversions by up to 7%, while 53% of mobile users abandon sites that take longer than three seconds to load. In a competitive digital landscape, a fast website is a key differentiator. Users expect instant access to content, and when a site feels sluggish, they are quick to leave and rarely return.
Beyond user experience, performance is now a ranking factor in Google’s search algorithm, especially with the introduction of Core Web Vitals as part of page experience signals. A slow site may struggle to rank well, leading to less organic traffic. Furthermore, performance affects accessibility and inclusivity: users on low-end devices or slower networks are disproportionately impacted by heavy pages. Optimizing for performance ensures your content reaches the widest possible audience, regardless of their hardware or connection speed.
Understanding the Core Web Vitals Metrics
Core Web Vitals are a set of three specific metrics that Google considers essential for delivering a great user experience on the web. They are:
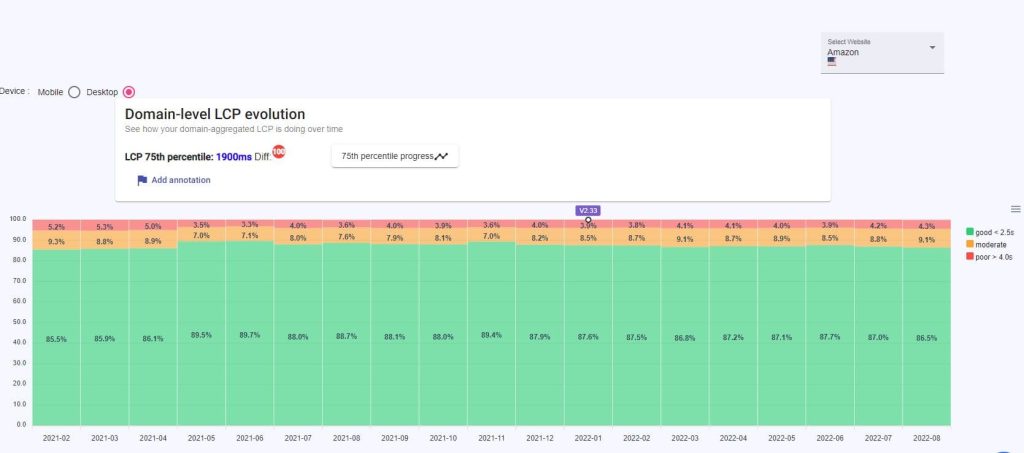
- Largest Contentful Paint (LCP): Measures loading performance. To provide a good user experience, LCP should occur within 2.5 seconds of when the page first starts loading.
- First Input Delay (FID): Measures interactivity. Pages should have an FID of 100 milliseconds or less.
- Cumulative Layout Shift (CLS): Measures visual stability. Pages should maintain a CLS of 0.1 or less.
These metrics are designed to capture real-world user experience, not just lab-based performance. They are measured in the field using data from actual users via the Chrome User Experience Report (CrUX). By focusing on these three metrics, developers can prioritize improvements that have the most significant impact on user satisfaction.

How to Measure Web Performance Effectively
Measuring web performance requires a combination of lab testing and field monitoring. Lab tools like Lighthouse, PageSpeed Insights, and WebPageTest simulate controlled conditions and provide detailed diagnostics. They are excellent for catching regressions during development and for identifying specific bottlenecks such as render-blocking resources or oversized images. However, lab data may not reflect the diversity of real-world devices and networks.
Field data, on the other hand, comes from real users and is collected via APIs like the Chrome User Experience Report or by using the web-vitals JavaScript library. This data gives you a true picture of how your site performs for actual visitors, but it lacks the granularity of lab tests. A robust performance strategy uses both: lab tests for debugging and optimization, and field data for monitoring and validating improvements over time.
Optimizing for Largest Contentful Paint (LCP)
LCP is often the most challenging metric to optimize because it depends on the critical rendering path. To improve LCP, start by identifying the largest element in the viewport—usually a hero image, video, or large block of text. Ensure that this element is not delayed by render-blocking resources like synchronous JavaScript or CSS. Inline critical CSS, defer non-critical JavaScript, and preload key assets such as fonts and hero images.
Server response time also plays a crucial role. Use a content delivery network (CDN) to serve static assets from locations closer to users, and consider upgrading hosting if your time to first byte (TTFB) is high. For images, modern formats like WebP or AVIF can dramatically reduce file size without sacrificing quality. Lazy-loading below-the-fold images can also help, but be careful not to lazy-load the LCP element itself, as that will delay its render.
Reducing Total Blocking Time and Improving FID
Total Blocking Time (TBT) is a lab metric that approximates FID by measuring the total time during which the main thread is blocked and unable to respond to user input. Long tasks—those exceeding 50 milliseconds—are the primary culprit. To reduce TBT, break up long JavaScript tasks into smaller, asynchronous chunks. Use code splitting to load only the JavaScript needed for the current page, and defer or remove unused scripts.
Another effective strategy is to minimize main-thread work by offloading tasks to web workers where possible. Avoid large, synchronous operations during page load, and consider using the requestIdleCallback API for non-critical work. Remember that third-party scripts, such as analytics or ad tags, often contribute significantly to main-thread blocking; audit them regularly and load them asynchronously or after user interaction.
Eliminating Layout Shifts for Better CLS
Cumulative Layout Shift occurs when visible elements move unexpectedly as the page loads. Common causes include images or iframes without explicit dimensions, dynamically injected content, and web fonts that cause text to reflow. To fix CLS, always include width and height attributes on images and video elements, or reserve space using CSS aspect-ratio boxes. For ads or embeds, allocate a fixed-size container to prevent shifts.
Font loading can be managed by using font-display: optional or preloading critical fonts to reduce the chance of text swapping. Avoid inserting new content above existing content unless triggered by user interaction. Finally, test your site on different viewports and network conditions to catch layout shifts that may not appear in a standard desktop test.
For a deeper dive into these metrics and their optimization, refer to our Core Web Vitals Guide.