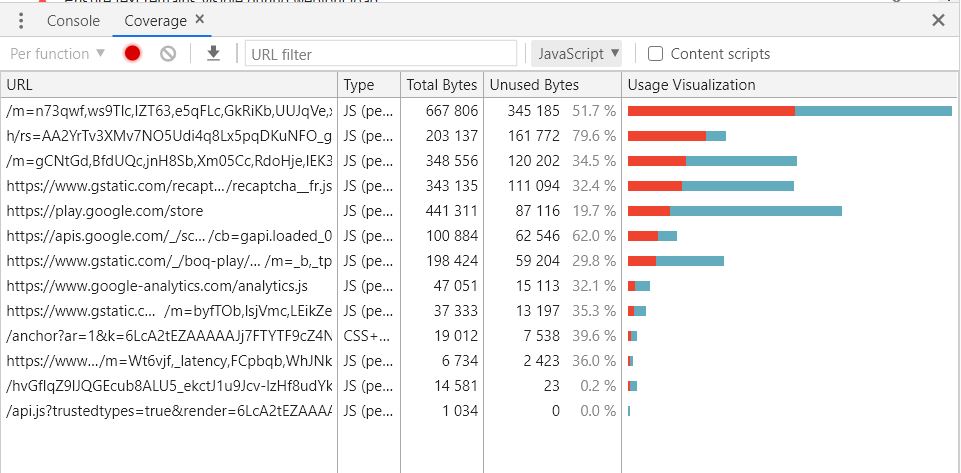
When Largest Contentful Paint is for loading performance, Cumulative Layout Shifts for visual stability, the pair “Total Blocking Time/First Input Delay” is for page interactivity and responsiveness.
All of these metrics are part of Web Vitals, an initiative by Google to provide shared quality signals to evaluate the user experience on the web.
Page interactivity and responsiveness
You click on a button but the page doesn’t respond, you try to fill a search form but the page is janky and you perceive a delay! That’s a frustrating experience.
That’s something we are facing online daily. Frustration and stress are the results of low-responsiveness web pages. Google suggests TBT and FID metrics to assess the reactivity of web pages.
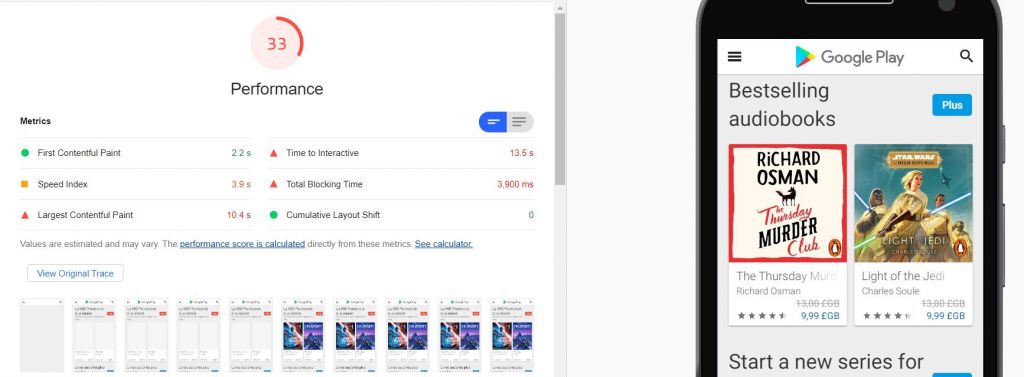
Why 2 metrics for page interactivity?
We can consider that TBT and FID represent the same thing: page interactivity and responsiveness to user interaction.
TBT is a synthetic (lab) metric where FID is a RUM (field) one. Since FID requires user interaction, we are not able to measure it with synthetic tools (Lighthouse doesn’t do any interaction on a page).
The effort you do to optimize TBT in the lab should be perceived on FID in the field. We can consider TBT as a proxy for FID.
What is TBT (Total Blocking Time)?
Total Blocking Time measures the total amount of time between First Contentful Paint (FCP) and Time To Interactive (TTI) where the page was busy enough to prevent interaction reactivity.
When loading a page and after downloading the needed resources (CSS, JavaScript files), the browser process them. During this phase, the main process risks being blocked by long tasks.
A long task is when it takes more than 50 milliseconds to be run on the main thread.
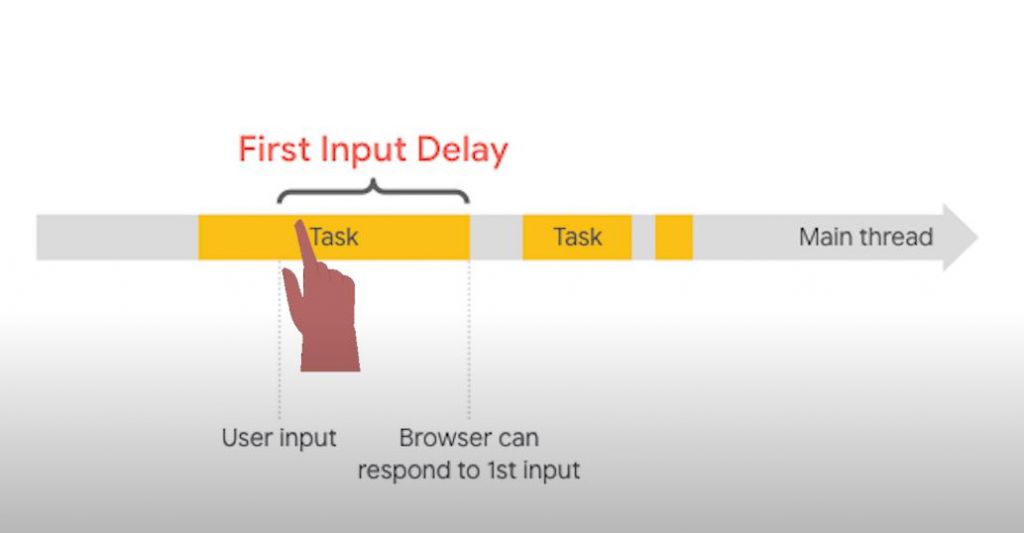
If a user interacts with the page during a long task, the browser is not able to respond before finishing it. The user will perceive a laggy page which is a bad user experience!
Consider we have a long task that has 150 ms duration. We consider this task blocking time as duration – 50 ms which gives 100ms.
TBT is simply the sum of each task blocking time. So if we have 4 long tasks with the following durations :
What is First Input Delay (FID)?
FID measures the time between user first interaction and browser readiness to respond to it. In a practical way, it is the delay a user could encounter when the browser is busy doing things during the loading.
All users won’t try to interact with your page at the same time that’s why they potentially could have different First Input Delays. Indeed, we should look at the distribution of FID across users.
What interactions are related to FID?
What interactions are not concerned with FID?
Scrolling and zooming are related to animations and could not be evaluated with FID metric.
What are good TBT and FID scores?
Note that TBT is weighted 25% in Lighthouse score calculation! It’s at an equal weight with LCP.
How to measure TBT?
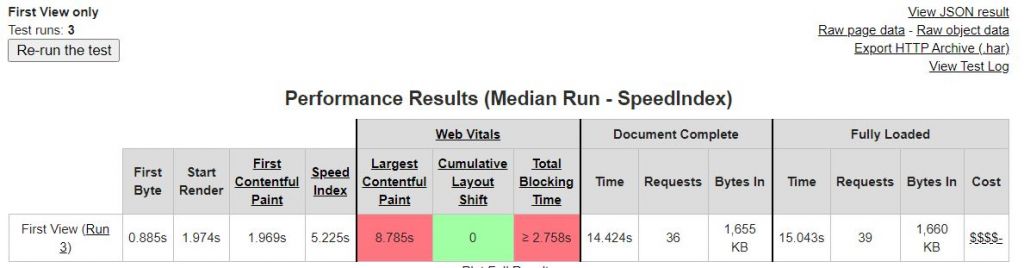
As we said, TBT is a synthetic metric. There are several ways to measure it:
How to measure FID?
FID is only measured in the field with real users sessions and interactions.
Track FID with CrUX thanks to this Datastudio dashboard https://g.co/chromeuxdash
How is that possible to have a bad TBT and a good FID?
TBT is mainly a probability/estimation of a possible blocking time causing delay for users.
FID is what your REAL users are facing as delay on their first interaction. Lighthouse testing conditions are potentially so different from your audience ones.
Another reason is that FID in CrUX is counted for the 95th percentile.
How to optimize TBT and FID?
I’m serious. The first culpable of high TBT/FID score is the amount of JavaScript the browser has to parse.
What’s next?
Interactivity is so important when it comes to user experience, mostly for mobile users. Optimize your TBT score, iterate, and monitor the impact on FID for real users.
The anatomy of a long task
To truly optimize Total Blocking Time, you need to understand what makes a task "long" in the browser's eyes. The main thread processes tasks in a queue: parsing HTML, evaluating scripts, handling input events, and painting frames. If a single task exceeds 50 milliseconds, the browser cannot respond to user input until that task finishes. This 50 ms threshold is not arbitrary—it aligns with the frame budget for smooth 60 fps rendering (16.7 ms per frame) but allows some slack for less critical work.
Long tasks are often caused by large JavaScript bundles, expensive layout calculations, or complex rendering operations. When a user clicks a button during a long task, the click event is queued but not processed until the task completes. The perceived delay is the blocking time of that task. By breaking long tasks into smaller chunks (yielding to the main thread), you can dramatically reduce TBT and improve FID.
How the browser handles input during blocking
When the main thread is busy, user interactions are not lost but delayed. The browser queues input events like clicks, taps, and key presses. Once the current task finishes, the browser processes the queued events as soon as possible. However, if multiple long tasks run consecutively, the delay accumulates, leading to a frustrating experience.
This behavior explains why FID is a field metric: it depends on real user timing. A synthetic tool like Lighthouse cannot simulate the exact moment a user interacts. Instead, TBT estimates the total blocking time during page load, which correlates with the probability that a user will experience input delay. The higher the TBT, the more likely a user will encounter a sluggish response.
Common causes of high TBT
Several factors contribute to excessive main-thread blocking during page load:
- Large JavaScript bundles: Parsing and compiling hundreds of kilobytes of JavaScript can take hundreds of milliseconds, especially on mid-range mobile devices.
- Third-party scripts: Analytics, ads, and social widgets often load synchronously and execute on the main thread, adding long tasks.
- Expensive CSS selectors and layout thrashing: Complex stylesheets and forced synchronous layouts can trigger long style/layout tasks.
- Unoptimized images and fonts: Decoding large images or font files can block the main thread if done on the main thread.
- Heavy frameworks and hydration: Client-side rendering frameworks may hydrate the entire page, causing a long task after initial paint.
Identifying these culprits is the first step toward optimization. Tools like Chrome DevTools Performance panel and WebPageTest can visualize long tasks and their sources.
Strategies to reduce Total Blocking Time
Reducing TBT requires a combination of code splitting, deferring non-critical work, and optimizing JavaScript execution. Here are proven techniques:
- Code splitting: Break your JavaScript into smaller chunks and load only what's needed for the initial route. Dynamic imports and route-based splitting can significantly reduce parse time.
- Defer or async non-critical scripts: Use the defer or async attributes to prevent scripts from blocking HTML parsing. For third-party scripts, consider loading them after the page becomes interactive.
- Minimize main-thread work: Audit your JavaScript for unnecessary work during load. Remove unused code, optimize loops, and avoid layout thrashing.
- Use web workers: Move CPU-intensive tasks (like data processing) off the main thread to a web worker, keeping the main thread free for user interactions.
- Optimize long tasks with yielding: If a task must run on the main thread, break it into smaller chunks using setTimeout or requestIdleCallback to yield control periodically.
Implementing these strategies not only improves TBT but also enhances overall page responsiveness and user satisfaction.
Monitoring TBT and FID over time
Optimization is an ongoing process. After making changes, you should monitor both lab and field metrics to ensure improvements. In the lab, run Lighthouse audits regularly and track TBT scores in your CI pipeline. In the field, use the Chrome User Experience Report (CrUX) to see real-user FID at the 75th percentile (the threshold for "good" is 100 ms or less).
Remember that TBT and FID are correlated but not identical. A low TBT in the lab does not guarantee a low FID in the field, but it reduces the risk. Conversely, a high TBT almost always leads to poor FID for some users. By continuously optimizing and monitoring, you can deliver a more responsive experience for everyone.
Beyond the first input: responsiveness throughout the page lifecycle
While FID focuses on the first user interaction, modern web applications require sustained responsiveness. After the initial load, users may interact with complex UI components, trigger data fetches, or navigate client-side. These interactions can also suffer from main-thread blocking if not managed carefully. The upcoming Interaction to Next Paint (INP) metric aims to capture responsiveness for all interactions, not just the first. To prepare for this evolution, apply the same principles: avoid long tasks, yield to the main thread, and keep the main thread as idle as possible during critical interactions.
By treating performance as a continuous commitment rather than a one-time fix, you can ensure that your web pages feel fast and responsive for every user, on every device.