Largest Contentful Paint (LCP) is one of the most important user experience and web performance metrics. LCP is part of Web Vitals, essential metrics for a healthy website defined by Google. It measures the loading performance. In this guide, you will understand what LCP is, how to measure it, and, how to improve its score. Keep reading!
What is LCP?
LCP or Largest Contentful Paint is a new web performance and user experience metric. It aims to reflect the loading performance of a web page. It tells when the biggest element visible in the viewport is loaded.
If we are talking about an e-commerce product page, the largest contentful element could be the product image. On a news article page, it would rather be the introduction text block or even the large hero image.
LCP is an important performance metric, if the largest element in the viewport is loading fast, the user will feel a pleasing experience and won’t leave.
Good, average, and bad LCP score?
Good (fast) LCP is when the largest content element loading within 2.5 seconds. On a domain level, try to reach the 75th percentile of page load across mobile and desktop users.
I’m writing a book about Web Performance, subscribe to let you know when it is out!
What are the eligible elements for LCP?
There are only a limited number of considered HTML elements to fire as the largest content. For the moment, only elements in Element Timing API are considered. Additional elements may be included in the future as more research is done.
How to measure LCP?
It exists several ways to measure Largest Contentful Paint on a given web page/site. Synthetic and Real User Monitoring (field) tools are both possible.
Field-data monitoring dashboards
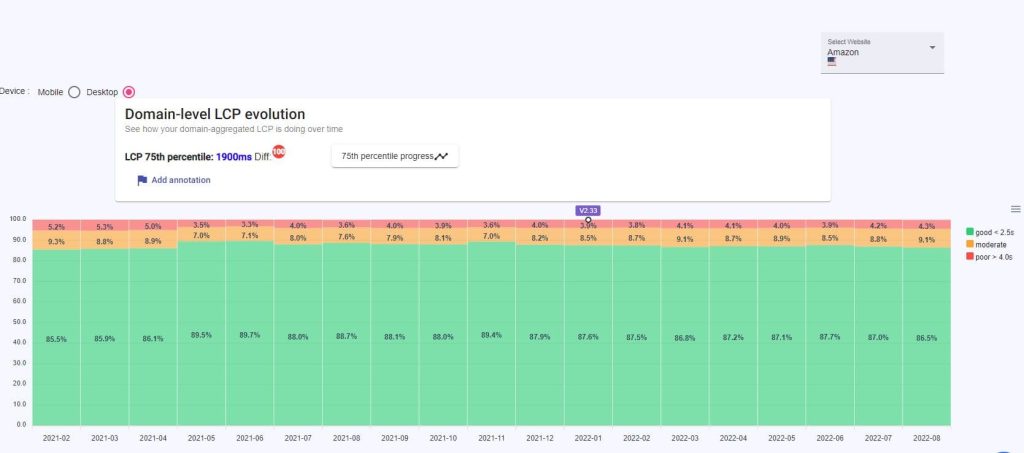
Dashboards built on real-user data (such as the CrUX dashboard or a RUM service) are the easiest way to measure, monitor and track the progress of Largest Contentful Paint over time, at domain level and at page level.
And finally, you can track individual page type LCP and detect wins or regressions (as we see in the following screenshot Good LCP moved from 77.1% to 53.5% overnight!).
Web Vitals Chrome extension
It’s in my opinion the simplest way to track LCP and other Web Vitals metrics (First Input Delay and Cumulative Layout Shift). Just install the extension and on every web page you load the extension adds a layer showing the metrics.
Caveats: The score depends on many factors such as your connection, your memory usage, your CPU, installed Chrome extensions…etc.
WebPagetest tool
WebPageTest is one of the most useful and advanced web performance synthetic tools. It does now support Web Vitals. Fill in with your website URL and choose the best settings that reflect your audience, and hit the “start test” button. Wait for the results page to check Web Vitals section in the table.
Google Lighthouse
Another way to measure LCP in synthetic is Google Lighthouse in Chrome Dev Tools. Go to Lighthouse tab and hit the “Generate report” button.
When the test is complete, you can check the LCP scoreamong the other metrics.
Lighthouse shares the same color codes for evaluating the LCP. Red for poor, Orange for ‘needs improvements’, and green for a good score.
Apart from the LCP score, Google Lighthouse highlights a very useful hint: The HTML element triggering for LCP. Scroll down the report to the diagnostics section and click on “Largest Contentful Paint Element”
TIP: Dock the Dev Tools to the bottom, when you hover the HTML element, the element on-page will be visually highlighted.
The same caveats as the Chrome extension apply. Lighthouse can be subject to variability depending on the audit context.
Chrome Dev Tools Performance Panel
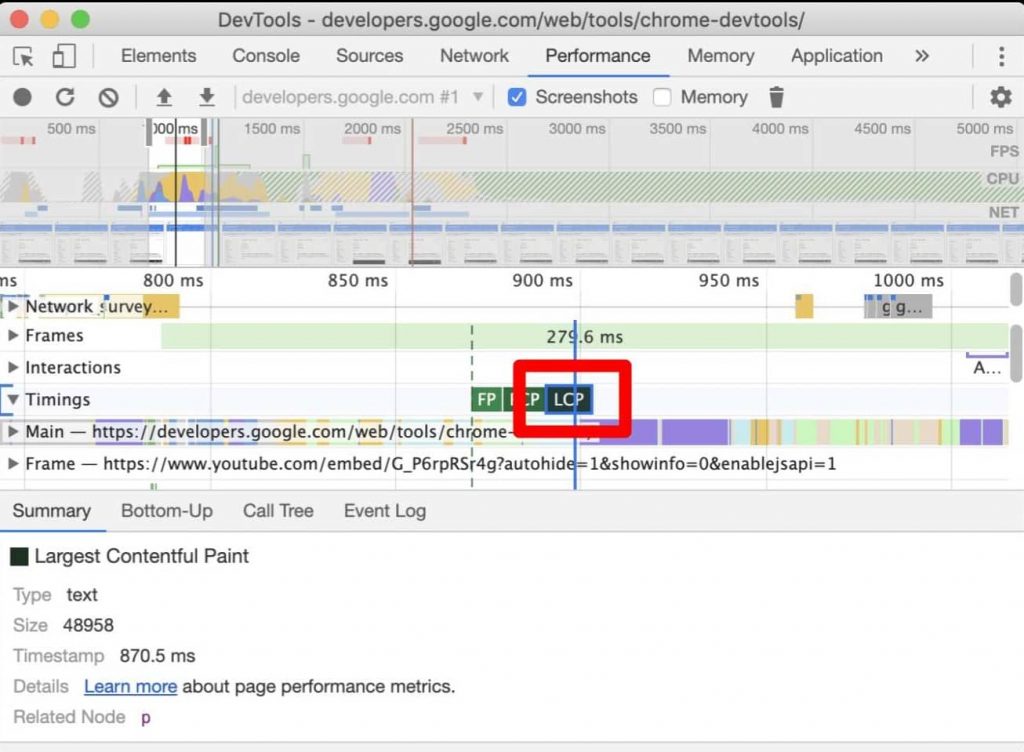
Additional way to audit LCP exits in Chrome Dev Tools Network tab. Run a performance profiling, check the timing sections. Click on the LCP marker to have interesting details at the bottom.
If you hover over the Related Node, it will highlight the element in the viewport the same way with Lighthouse.
Chrome User Experience Report (CrUX)
Synthetic tools are useful, they let us measure, debug and monitor web performance in a given managed context. Unfortunately, they are not sufficient and don’t reflect the real-life and the real user experience. Field tools come in handy to help us better understand how things perform. Chrome User Experience Report provides many performance metrics and it is updated monthly.
=> Create your Web Vitals dashboard here https://g.co/chromeuxdash
PageSpeed insights
Google PageSpeed Insights is another useful tool to measure and report web performance on both synthetic and field. Go to the tool, fill in a URL, and hit ANALYZE button.
Let’s audit the Baby care Amazon’s listing page. Link to PageSpeed Insights report. Let’s dive into this report to better understand how to read it.
For the trailing last 28-day period, 94% of the sessions have a good LCP (<2.5 seconds), 4% an average LCP, and 2% are facing a poor LCP. The 1,3 s value represents the 75th percentile of all the sessions.
Note that this data comes from the CrUX dataset. The only difference is that PSI is updated daily and aggregates data for a 28-day period. However, CrUX is updated every second Tuesday of the month.
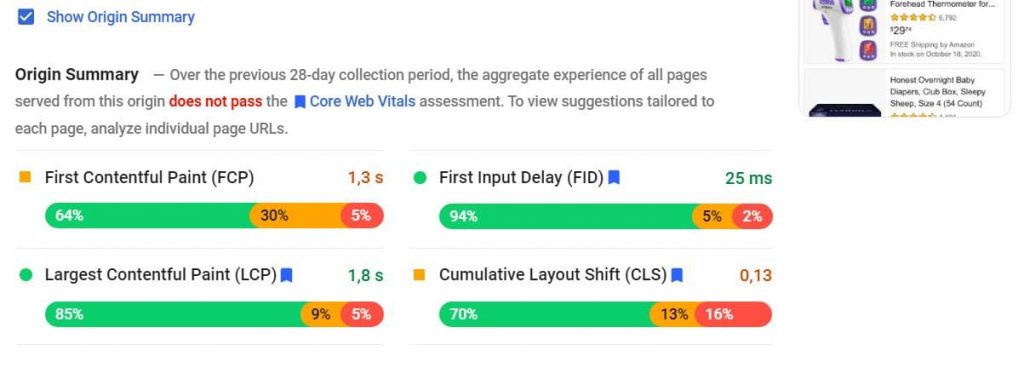
The second important section in PSI is the Origin summary of field data. It gives an aggregation of the metrics for the whole domain name www.amazon.com. Tick the checkbox “Show origin summary” to show up this section.
We can read this section the same way as the URL one. Here, on the domain level, we have a worse distribution for good LCP, only 84% compared to 94%. We could maybe (with precaution) acknowledge that the Baby Care page is not the less performing one.
The 75th percentile value of LCP for the origin is rather better, 1.8 s.
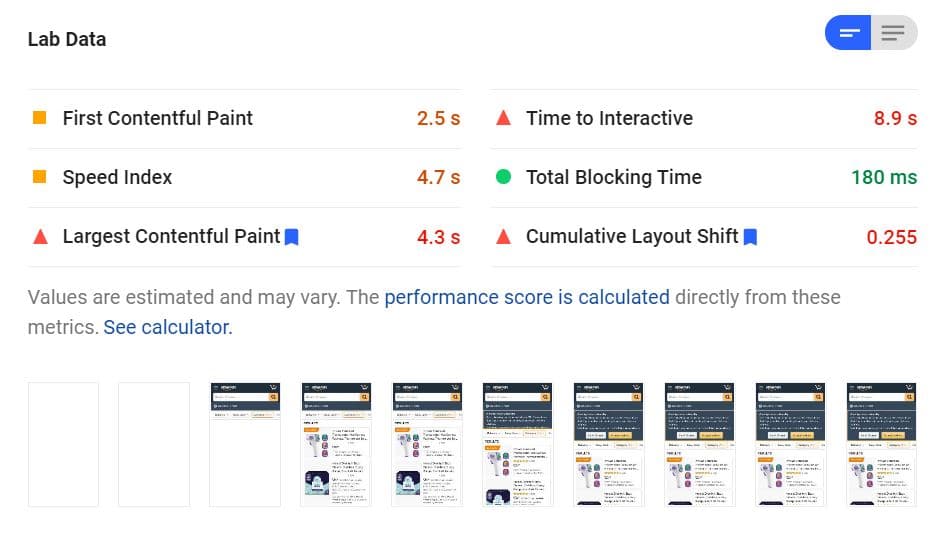
Is it normal to have disparate values of LCP between field and lab data? YES.
Field data represents the real-life experience for real users having various and different configurations (hardware, CPU, memory, internet connection, latency…etc). That’s why we could have different and contradictory scores.
Measure LCP with JavaScript
Chrome team shared a Web Vitals JavaScript library on Github.
How to improve LCP score ?
My approach is, before starting optimizations you should first define what should be your LCP elements per page type. As an example, for an e-commerce website, we could have this table:
If assets take time to arrive at the browser, their rendering will be delayed. Optimizing TTFB is the first thing to do in your LCP optimization journey. Some ways to have a fast server response:
By reducing the transfer size, elements arrive faster to the browser and have better chances to be displayed faster to users.
Preload important resources (Fonts) Defer non-critical CSSDefer non-critical JavaScriptInline critical CSSPreconnect to third party origins (especially when they are needed for the critical rendering) What’s next? Define your LCP per page type, work on optimizing it and iterate! Check how to optimize the other Web Vitals metrics :
Why LCP matters for user experience and business
Largest Contentful Paint is more than a technical metric; it is a direct proxy for perceived page speed. When the main content of a page appears quickly, users are less likely to abandon the site. Research from Google shows that pages with an LCP of 2.5 seconds or less have significantly lower bounce rates compared to slower pages. For e-commerce, a fast LCP can translate into higher conversion rates, while for content sites it means more engaged readers.
From a business perspective, LCP also influences search engine rankings. Google has incorporated Core Web Vitals, including LCP, into its ranking algorithm. A poor LCP can lead to lower visibility in search results, reducing organic traffic. Therefore, optimizing LCP is not just about user experience—it is an essential part of SEO strategy.
How LCP is calculated and what can go wrong
LCP is determined by the render time of the largest image or text block within the viewport, relative to when the page first started loading. The browser continuously monitors elements as they load and updates the LCP candidate until the user interacts with the page. Common issues that delay LCP include slow server response times, render-blocking JavaScript and CSS, slow resource load times, and client-side rendering that delays the display of main content.
For example, if your hero image is lazy-loaded or has a large file size, it will delay the LCP. Similarly, if critical CSS is not inlined, the browser must wait for external stylesheets before rendering the largest text block. Understanding these bottlenecks is the first step toward improvement.
Common LCP optimization techniques
Improving LCP typically involves a combination of server-side and front-end optimizations. The following list outlines proven strategies:
- Optimize server response time: Use a fast hosting provider, implement caching, and minimize database queries.
- Preload key resources: Use rel="preload" for the LCP image or font to fetch it early.
- Inline critical CSS: Reduce render-blocking by inlining the CSS needed for above-the-fold content.
- Compress and resize images: Serve appropriately sized images in modern formats like WebP or AVIF.
- Avoid client-side rendering for main content: Ensure the LCP element is present in the initial HTML response.
Implementing these techniques can significantly reduce LCP times. However, it is important to measure the impact after each change to avoid regressions.
Advanced LCP debugging with browser tools
Beyond the tools mentioned earlier, you can use the Performance panel in Chrome DevTools to identify what is blocking LCP. Record a page load and look for the LCP marker in the timings track. The details pane will show the element and its load time. Additionally, the Network panel can reveal whether the LCP resource is being delayed by other requests or by connection setup.
For field data, the Web Vitals library can be integrated into your site to collect LCP from real users. This helps you understand how your optimizations perform across different devices and network conditions. Combining synthetic and field data gives a complete picture of LCP performance.
Monitoring LCP over time
LCP is not a set-and-forget metric. Changes to your site, third-party scripts, or content can affect it. Establish a monitoring routine using tools like the CrUX dashboard or Search Console to track LCP at the 75th percentile. Set performance budgets and alert when LCP exceeds your threshold. Regularly review the LCP element to ensure it aligns with the most important content on the page.
Remember that LCP can vary by page type. A product page may have a different LCP element than a blog post. Segment your monitoring by page template to identify specific issues. With consistent measurement and optimization, you can maintain a fast LCP and deliver a better experience to your users.